Figure 9-28 The Opalis Integration Server Interface.
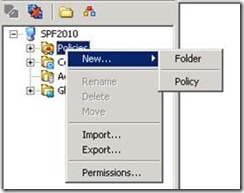
By opening the Opalis Integration Server and right-clicking on the Policies tree select Policy to create a new Policy (see Figure 9-29). This will create a policy in the main section of the interface (see Figure 9-28 B). For the scenario with the new Policy we need a process to run on a schedule. Expand the section called Global Settings and right-click Schedule and select New Schedule (See Figure 9-30). For this SharePoint specific example the Schedule name is Content Databases (see Figure 9-31). By updating the Detail section this will check on the size of the content databases in a SharePoint environment once a day (see Figure 9-32).
Figure 9-29 Creating a new Policy in Opalis.
Figure 9-30 Creating a new Schedule in Opalis.
Figure 9-31 General Scheduling information in Opalis
Figure 9-32 Setting a Schedule in Opalis.
Testing
Opalis has the ability to run tests on the Policies created. The following example has a Custom Start object that runs a Database Query (see Figure 9-33). In the Task bar select Test to perform a test on the Policy. This brings up a new application window that allows the user Run, set Breakpoints and debug objects (see Figure 9-34).
Figure 9-33 Simple Policy with two connected objects.
Figure 9-34 Policy Testing Console
In the Testing Console if an individual object is selected the properties are displayed in the Design Time Properties window (see Figure 9-35). There is a simple SQL statement that runs a built in stored procedure that returns all the databases on the SQL Database that the Query Database object is setup to connect to. By clicking the Run button the two objects will execute and provide a log of their actions, properties, and return values (if available) (see Figure 9-36).
Figure 9-35 Design Time Properties for the Query Database object.
Figure 9-36 Policy Testing Console displaying the populated logs after running a policy.
The Query Database stores all its returned values in the Full lines as a string with fields separated by a ‘;’. By highlighting that line in the logs the interface adds a ellipsis button. But clicking on the ellipsis button a small modal window provides the data returned but the query (see Figure 9-37). While the results are interesting the name of the modal is very important. The data is designated as Published Data. So when objects are connected in the Policy and there is a desire to interact with the data, this is the actual data that is published from the Query Database object that was defined.
Figure 9-37 Published Data Browser displaying the results of the Query Database object.
By exiting the Test client and returning to the Integration Server Client we can show how it is possible process this Published Data some more. By selecting and adding a Run .Net Script object to the Policy the capacity to run C#, Jscript, PowerShell or VB.Net code is available (see Figure 9-38).
Figure 9-38 The Run .Net Script Object displaying the types of script it can run.
After selecting PowerShell as the script type it is necessary to right-click in the Script section to open a context menu. This allows the ability to select the Published Data from the Query Database object (or from a Global Variable). Select Published Data and then the field Full line as string with fields separated by ‘;’ the script section will display a hyperlinked section of code that can be assigned to a variable in PowerShell. By adding a few more lines of PowerShell for processing and putting the same Policy in the Test Console again it is possible to see the first value passed in from the Query Database object into the PowerShell (when set as a breakpoint) script (see Figure 9-39).
Figure 9-39 Policy Testing Console in debug mode with a breakpoint hit at the Run .Net Script object.


![clip_image002[4] clip_image002[4]](https://blogger.googleusercontent.com/img/b/R29vZ2xl/AVvXsEha0CMKXabPa-R5tXIMak8xctJTTV2s0ugRhwUc8qQTgOxzc2SJWL6VOqz_VOWKFIQ-wWV2PxVBc9gM5q3ttfSAX6tDwk_o0WfDHuBRwu5Vhaz5Mj7GVi967GPp_VXNN29nCcnJ4QC0uac/?imgmax=800)
![clip_image004[4] clip_image004[4]](https://blogger.googleusercontent.com/img/b/R29vZ2xl/AVvXsEiWlH6glbDATUdqg84JdLIgcdZzLZpkdYShwS6L9-ereR1yPRC1iowNRwho29QPqvCc5xOUfNNOgkOUvGqBTZ30BYKbM1-i-0Es0DddegUcZbow_fF_DaanzA7vp5RdLVpQ_Ql9w2r8tvU/?imgmax=800)
![clip_image006[4] clip_image006[4]](https://blogger.googleusercontent.com/img/b/R29vZ2xl/AVvXsEjrN-xt94aYq7_R0zb_eMOGnMwUjU733dF1AvAku9xCpl2IReHNLLjjeS7NTA2nBxO09KkAEP5GAPeYKDaaF70mAeFXg5Rg-KK_d6pnf8exgebCKKhuSKIDoslJ31z6-fwu34x4CWbLeB0/?imgmax=800)
![clip_image008[4] clip_image008[4]](https://blogger.googleusercontent.com/img/b/R29vZ2xl/AVvXsEifQLGPx73AJXo2-Uq0pWhW8fMHzR-_IhAMZ0mkIjoSuredr2LweW7a0xSBQUH6Yhp2n6JRSNpMNEUpRKVXm8jssWbO88rYEOSq0PI4IJSN6Ou5AtHCvPfLZNdxR1Qv_1_IpuF5NxzzoFY/?imgmax=800)
![clip_image010[4] clip_image010[4]](https://blogger.googleusercontent.com/img/b/R29vZ2xl/AVvXsEg9CitlBBv6RiqeHI60wi9KRZO1NnjEEs-GdjZVVK62l6e4a76ULfnLlMWQiequeIjQl0gLXv3VJogI6eIfLgg69wC70z3zxkvp0gQAWkk36RU_8pDGLmXTTdDxGoA0qkRm43jQAMDIEeY/?imgmax=800)


No comments:
Post a Comment